
⛺️ The Art and Science of Setting Goals
[Founder's note: Every time I watch the 'Last Dance' a documentary on Michael Jordan and the 1990s Chicago Bulls- one of the most successful eras for the team, I am reminded of the concept of Lead and Lag indicators. A simple framework for setting goals. Now, the application of this theory is quite wide; use it in your organisation, for yourself, teams, your occasional badminton game, you name it. Particularly, save this one for later, when you'll be setting your yearly goals in March.
This piece was published for ARC's Leadership Campfire on 2nd April 2025]
Also, if you have the time, please fill out this short feedback form to let us know how we're doing. Link here.
— Adi Raheja
“Reduce employee turnover by 25% in the coming year.”
While this might seem like an attractive goal, the problem with it is that it focuses on the outcome. However, to achieve this, you need to understand the difference between lead and lag indicators
The concept of Lead and Lag Indicators.
Lag indicators measure the end result- what has already happened. These indicators are often the ultimate goal of a person, team or even a business. Revenue growth, customer satisfaction scores or employee retention rates are all examples.
However, by the time we measure a lag indicator, it’s too late to change it.
Lead indicators, on the other hand, are the actions or behaviours that drive those results. They are predictive measures that can be influenced in real-time, increasing the likelihood of achieving the desired outcome.
In the section below, I will be sharing 3 principles of setting lead and lag indicators.
The famous case of the Chicago Bulls
Consider the case of Chicago Bulls, a basketball team in the NBA. Until 1991, they hadn't won any titles, their goal was similar to all teams- increase the win rate. The team couldn’t directly control the outcome of each game and hence they focused on their lead indicators.
Metrics like the number of successful passes shot accuracy in practice, and defensive efficiency.
Under the leadership of head coach Phil Jackson, the Bulls adopted the famous ‘Triangle Offense’, a strategy that wasn’t just about emphasising ball movement, spacing and teamwork (because these are still lag indicators).
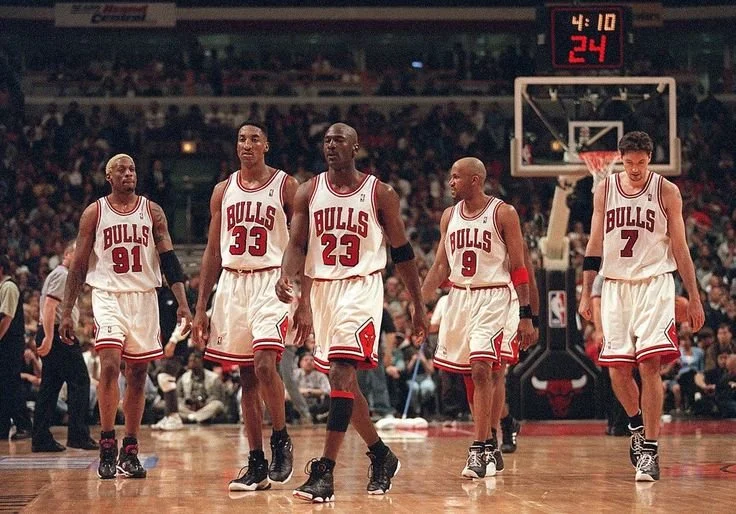
Michael Jordan, Scottie Pippen and later, Dennis Rodman were instrumental in executing this system.
Jackson and his assistant tracked specific lead indicators such as:
Pass-to-short ratio: Ensuring the team moved the ball at least 3 times per possession before taking a shot.
Defensive rebounds per game: Rodman, for example, averaged 16.1 rebounds per game in the 1996-97 season, directly reducing opponents' second-chance points.
Assist percentage: Pippen’s playmaking ensured that over 60% of their field goals were assisted, reflecting strong teamwork.
Over time, their discipline in these lead indicators led to an extraordinary six NBA championships between 1991 and 1998, with two separate three-peats (1991-1993 and 1996-1998).
By focusing on what they could control, they won titles in an effective and repeatable way.
And, that brings me to...
3 Principles of Lead and Lag Indicators
1] Direct Co-relation
The Lead indicator should have a direct correlation with the outcome without any intermediaries. An increase in pass-to-shot ratio directly improved shot quality and scoring efficiency, leading to a higher win rate.
2] Done repeatedly
In a disciplined manner, the activity or task needs to be repeatable, like a cadence. The 3 Lag indicators (passes, rebounds and assists) were repeated throughout the season, embedding it into their system.
3] Effectiveness
Minimum effort, maximum impact. Over time, the quality of passes and shots get better, leading to better efficiency with the same effort. As the players mastered their system, they didn’t just pass more; they passed smarter, leading to higher-percentage shots and a stronger, more efficient offence.
The Cogwheel Analogy
Think of lead and lag indicators as two interlinked cogwheels. The larger wheel represents the lag indicator, while the smaller wheel represents the lead indicators. To move the bigger wheel, the smaller one must rotate consistently, with discipline, and in a way that directly influences the larger outcome.
By focusing on what is within our control—our lead indicators—we set ourselves up for achieving our larger goals.
Take some time out and create one for yourself. I am open to answering any of your questions.
Tell us how we are doing, give us feedback here.